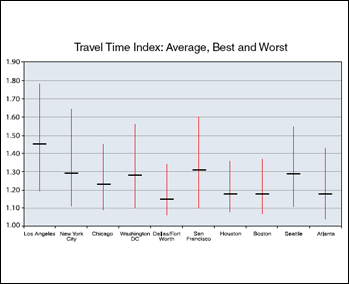
| “Time is money” has never been a more meaningful aphorism given the cost of fuel. Companies looking for new sites for warehouses or manufacturing plants should take special note of recent research that identifies the worst traffic congestion in the U.S. |
| |
| The ten worst metro areas are shown in the accompanying graph, along with the Travel Time Index (TTI) which is the ratio of actual to uncongested travel time as calculated by INRIX (www.inrix.com). For example, a ratio of 1.25 means travel times are increased by 25% due to congestion. |
| |
| The TTI is shown for each metro area (denoted by the short horizontal line), as well as the best and worst TTI during peak travel hours. These indexes are denoted by the highest and lowest points on the vertical bar for each market. |
| |
| Los Angeles is ranked number one for travel congestion, with a TTI of 1.45. During the worst peak travel times, the index jumps to 1.78, but is only 1.19 during the best peak travel times. |
| |
|
|
 |
| [Place cursor over graph to enlarge] |
| |
|